メニューの「釣り日和」では、今日から7日先までの海の様子を1画面で確認できます。ホームの「今日の海況」からも開けます。
Fishing Conditions in the menu shows the state of the sea from today through seven days ahead, all on one screen. You can also open it from the conditions card on the Home screen.
1. どの会員ランクでも見られるもの
潮回り・満潮 / 干潮の時刻・朝夕のまずめ・月齢は、どの会員ランクでも表示されます。端末とサーバの計算で求めているので、通信の少ない場所でも出ます。
The tide type, the times of high and low water, the dawn and dusk windows and the moon phase are shown at every tier. They are calculated rather than fetched, so they work even where reception is poor.
潮位のグラフには、現在時刻の縦線と今の潮位、満潮・干潮の時刻と潮位、時刻の目盛り、昼と夜の塗り分けが出ます。
The tide chart carries a line at the current time with the current height, the times and heights of high and low water, an hourly scale, and day and night shaded differently.
| 場所 | 潮位の出どころ |
|---|---|
| 日本近海(気象庁の潮位表地点から60km以内) | 気象庁の潮位表(どの会員ランクでも) |
| 海外 | Gold 以上は Marea、それ以外は Open-Meteo のモデル値(約8km格子の参考値・平均海面からの高さ。岸の近くや湾の奥では実際と異なることがあり、潮の満ち引きが小さい海域ではその旨を表示します) |
| Where | Where the tide comes from |
|---|---|
| Near Japan (within 60 km of a JMA tide-table station) | Japan Meteorological Agency tide tables (every tier) |
| Elsewhere | Marea from Gold; otherwise Open-Meteo model values — a reference figure on a roughly 8 km grid, heights from mean sea level. They may differ near the shore or deep inside bays, and we say so where tides are very small |
今日と明日の天気・気温・風・波(3時間ごと)と、その日の海面水温・荒れ具合(日中4〜20時で最も荒い区分)も、どの会員ランクでも「天気と風・波」に表示されます。
Today's and tomorrow's weather, temperature, wind and waves every three hours, with the day's sea surface temperature and how rough it gets (the roughest level between 04:00 and 20:00), are shown at every tier under *Weather, wind & waves*.
日本全国239地点の潮見表と今日・明日の天気・風・波は、公式サイトの潮見表でもサインインなしで見られます。
Tide tables for 239 stations across Japan, with today's and tomorrow's weather, wind and waves, are also on the website's tide tables — no sign-in.
2. 出撃スコア(Silver 以上)
Silver 以上になると、1時間ごとの風速・風向、波高・周期、海面水温、気圧とその3時間の変化、降水、天気(アイコンと気温)、潮流の実値、7日先までの海況が加わり、1時間ごとの「出撃スコア」が表示されます。
From Silver you also get hourly wind speed and direction, wave height and period, sea surface temperature, pressure and its three-hour change, rainfall, the weather (icon and temperature), real current values and the seven-day outlook — plus an hourly bite score.
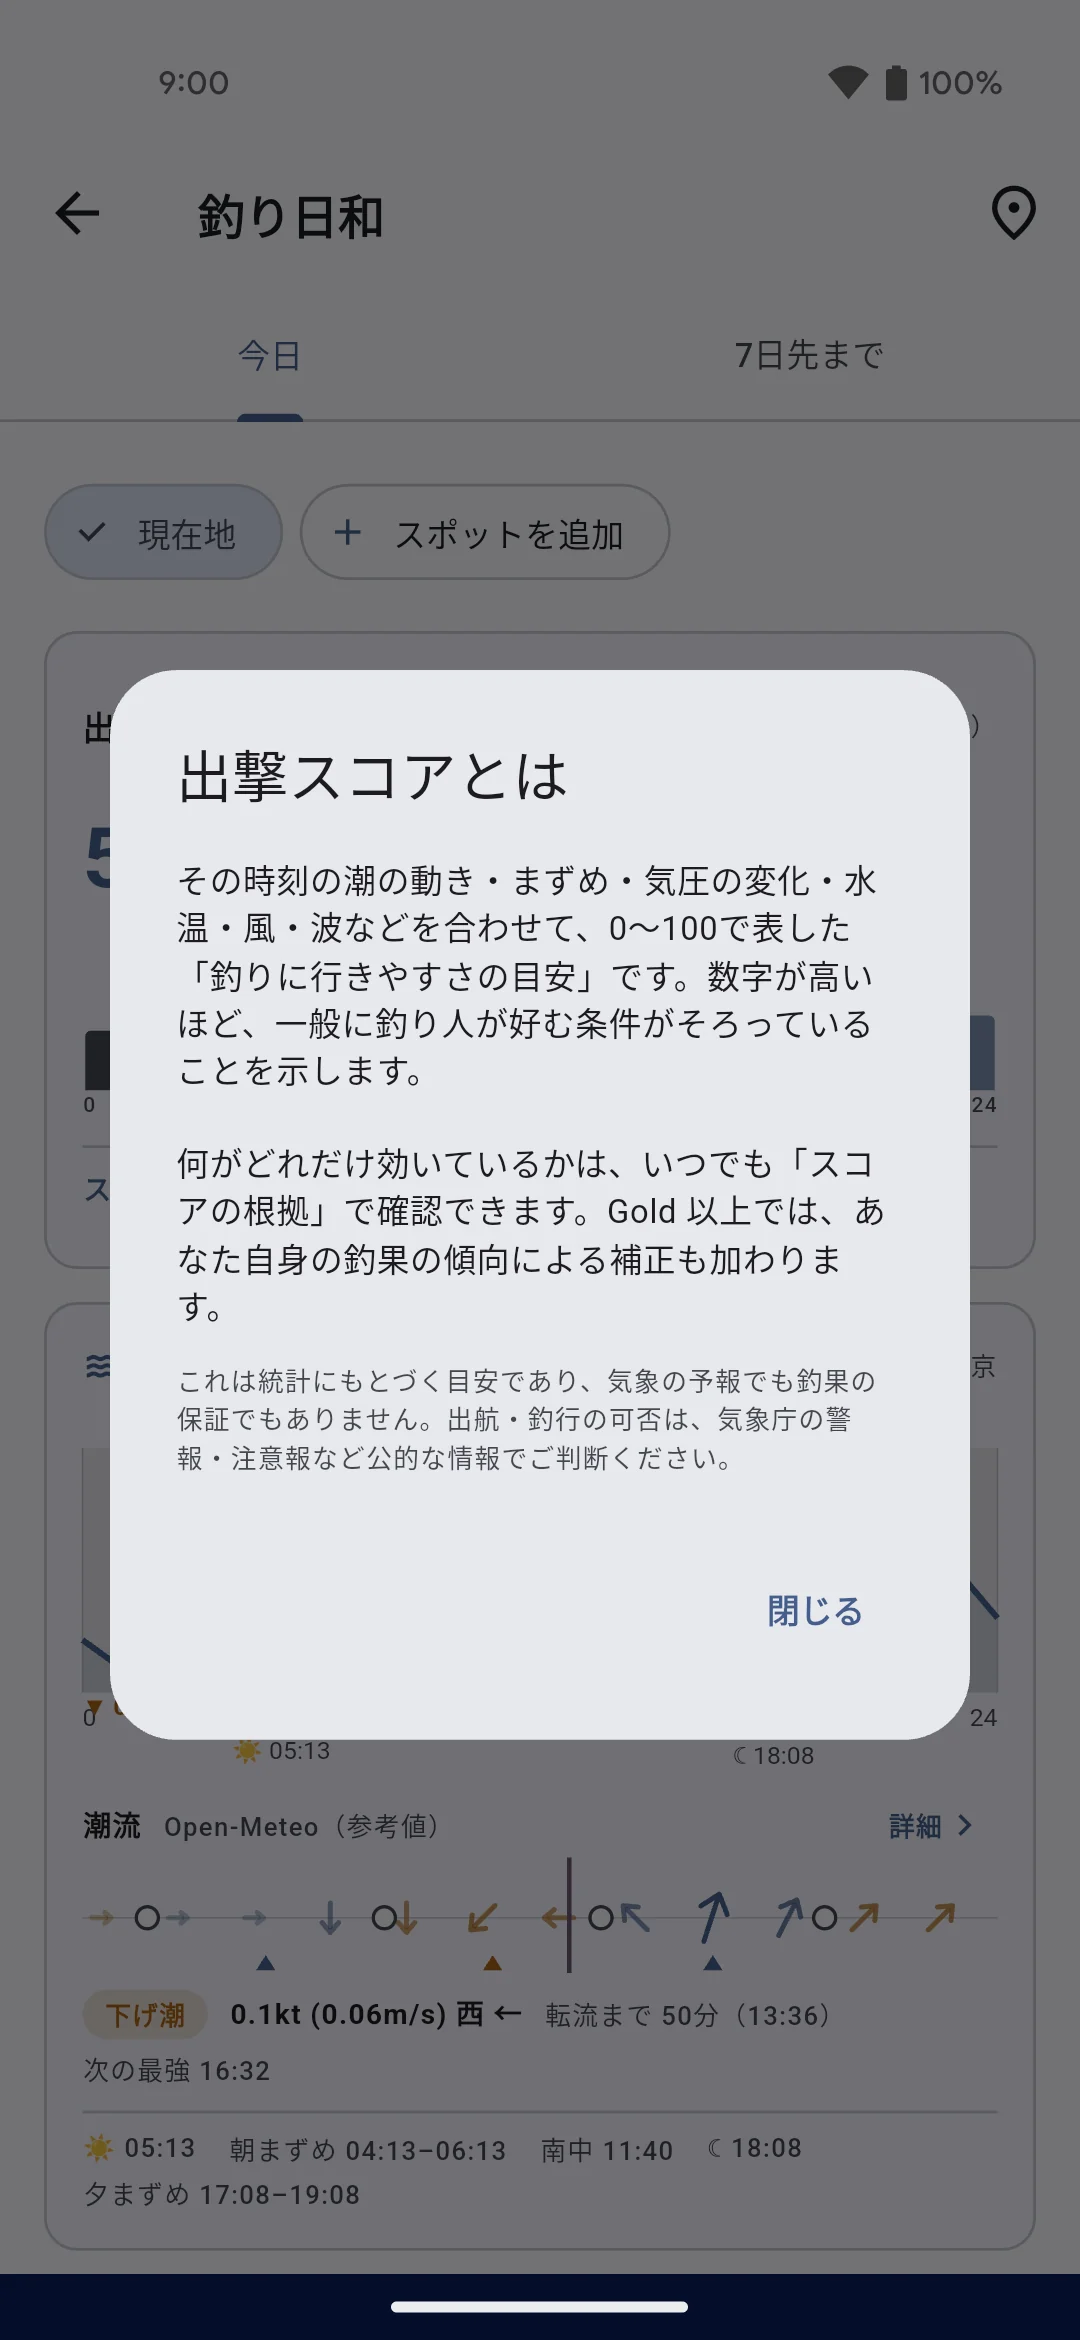
「なぜその点数なのか」の内訳(まずめ・潮の動き・気圧の変化・水温・風・波)は、「根拠を見る」をタップすると全件表示されます。点数の横の「?」をタップすると、出撃スコアが何かを説明します。Gold 以上なら、あなた自身の釣果統計にもとづく補正も加わります。
Tap See the reasons for the full breakdown of *why* it is that number — the bite window, the moving tide, the pressure change, the water temperature, the wind and the waves. The ? beside the score explains what it is. From Gold, your own catch statistics adjust it as well.
⚠️ 出撃スコアは気象の予報ではありません。 過去の釣果統計にもとづく目安であり、釣果を保証するものでもありません。強風・高波の注意表示と荒天のお知らせも目安で、気象庁の警報・注意報ではありません。出航・釣行の可否は、気象庁の警報・注意報などの公式情報と現地の状況で判断してください。表示している気象・海況の数値は、気象庁や外部の気象データ提供サービスが公表している値をそのまま出しています。
⚠️ The bite score is not a weather forecast. It is an indicator built from past catch statistics, and it does not guarantee a catch. The strong-wind and high-wave cautions and rough-weather notices are indicative too, and are not official warnings. Decide whether to go out from official warnings and advisories and the conditions in front of you. The weather and marine figures are presented exactly as published by the Japan Meteorological Agency and external weather data providers.
3. 潮流ストリップ
潮位グラフの真下に「潮流ストリップ」があり、1時間ごとの流れの向きと強さを矢印で示します(○ は転流、▲ は最強、縦線は選択中の時刻。矢印をタップすると時刻を選べます)。
Directly under the tide chart, the current strip shows the direction and strength of the flow hour by hour as arrows — ○ marks slack water and ▲ the peak, and the vertical line is the hour you have selected. Tap an arrow to move it.
| 場所 | 出るもの |
|---|---|
| 東京湾・伊勢湾・瀬戸内海・島原湾と八代海・鹿児島湾・奄美・沖縄・先島・大東・来島海峡の10海域 | 海上保安庁の潮流推算による流速(ノット・m/s)と流向、転流・最強の時刻 |
| それ以外の場所 | Open-Meteo のモデル値(約8km格子の参考値) |
| Silver 未満、または取得できないとき | 潮位の変化から求めた「潮の動き」=上げ潮 / 下げ潮と、速い・ふつう・ゆるい・ほぼ止まり(流速の数値は出ません) |
| Where | What you get |
|---|---|
| Ten sea areas — Tokyo Bay, Ise Bay, the Seto Inland Sea, Shimabara and Yatsushiro Bays, Kagoshima Bay, Amami, Okinawa, Sakishima, Daito and the Kurushima Strait | Speed (knots and m/s) and direction from the Japan Coast Guard's tidal current predictions, with the times of slack water and the peak |
| Anywhere else | Modelled values from Open-Meteo — a reference figure on a roughly 8 km grid |
| Below Silver, or when the data cannot be fetched | Tidal movement derived from the tide curve — flooding or ebbing, and fast, normal, gentle or near-slack (no speed figure) |
「詳細」を開くとコンパスと24時間の流速、転流・最強の一覧が見られます。「7日先まで」タブには、その日の最大流速が1語で出ます。
Details opens a compass, 24 hours of speeds and a list of slack and peak times. The *next 7 days* tab summarises each day's maximum in a word.
海上保安庁のデータを使っているときは、画面下部に「サービスの内容は海上保安庁によって保証されたものではない」旨の注記と出典、「航海用ではありません」が表示されます。
When Japan Coast Guard data is in use, a note at the bottom of the screen states that its contents are not guaranteed by the Japan Coast Guard, gives the source, and says not for navigation.
4. マイスポット
よく行く釣り場は「マイスポット」として登録できます。登録した場所はあなたにだけ表示され、他の利用者には公開されません。
Save the places you fish as My Spots. They are visible only to you and are never shown to other users.
| 会員ランク | 登録できる数 |
|---|---|
| Bronze | 1件 |
| Silver | 5件 |
| Gold | 50件 |
| Platinum | 100件 |
| Tier | How many |
|---|---|
| Bronze | 1 |
| Silver | 5 |
| Gold | 50 |
| Platinum | 100 |
| ベル | いつ届くか |
|---|---|
| 荒天のお知らせ(どの会員ランクでも) | 翌日の日中に強風(風速12m/s以上)・高波(1.5m以上・海のスポット)・雷雨の予報値(Open-Meteo)が出ているとき。新しく登録するスポットは最初からオン |
| 好条件アラート(Gold 以上) | 翌日の条件が良さそうなとき(既定はオフ) |
| Bell | When it fires |
|---|---|
| Rough-weather notices (every tier) | When strong wind (12 m/s or more), high waves (1.5 m or more, sea spots) or thunderstorms are forecast (Open-Meteo) for tomorrow's daytime. On by default for newly saved spots |
| Good-conditions alerts (Gold and above) | When tomorrow looks good (off by default) |
どちらも前日の夕方(現地時間の18時ごろ)に、1つのスポットにつき1日1回までです。荒天のお知らせを送った日は、好条件アラートは送りません。
Both arrive the evening before, around 18:00 local time, at most once a day per spot. On a day we send a rough-weather notice, no good-conditions alert is sent.
河川として登録した場所では、波と水温の代わりに川の流量(増水・減水の目安)を表示します。約5km四方の大きな川の値なので、小さな川や渓流は代表しません。
For a spot saved as a river we show river discharge — a guide to rising or falling water — instead of waves and water temperature. It covers the largest river in a roughly 5 km cell, so it does not represent small rivers or streams.
出撃スコアは「行くかどうか」を
決めてくれるものじゃなくて、
考えるための材料だよ。