
海のマップ・海底地形マップを公式サイトで公開しました — サインイン不要・無料でブラウザから
公式サイトに「海のマップ・海底地形マップ(Web 版)」を追加しました。アプリの「海のマップ」と「海底地形マップ」と同じレイヤーを、Google マップの上に重ねてブラウザから見られます。サインインは不要、会員ランクに関係なく無料です。パソコンの大きな画面で、釣行前に海の様子を眺めるのにお使いください。
見られるもの
- 海のマップ(海上保安庁「海しる」) — 規制・区域(港則法区域・航路・びょう地、海交法航路、指定錨地・検疫錨地、米軍演習区域、投棄区域、港湾区域・漁港区域)、航路標識・障害物(灯台・灯浮標・灯標・沈船・海底障害物)、等深線・底質(20〜200m の等深線と底質)の3グループ。ズーム7〜16で表示されます。記号の意味は使い方ガイドの「海のマップ(記号の読み方)」にまとめてあります。
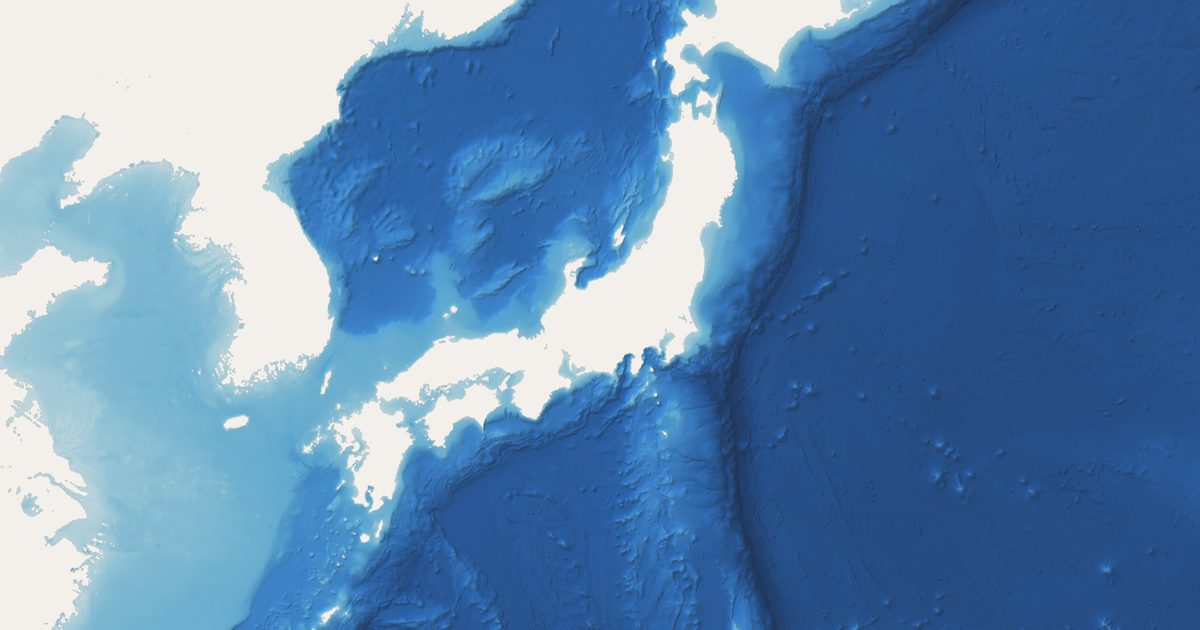
- 海底地形マップ(GEBCO) — 世界中の海底の起伏を、深さの色分けと陰影で表示します。陸地は透けるので、Google マップの地名や海岸線はそのまま読めます。
- クリックで水深 — 地図をクリック(スマートフォンでは長押し)すると、その地点のおおよその水深(参考値)が出ます。
※ 釣りのための参考情報であり、航海用ではありません。区域の境界や水深には誤差があり、最新でないこともあります。航海の判断は、海上保安庁の海図と最新の水路通報・航行警報でお願いします。海底地形は約450m格子の推定のため、岸に近い場所は海のマップの「等深線・底質」のほうが正確です(日本周辺)。
アプリとの違い
Web 版は「見る」ための入口です。釣果をこの地図に重ねる・出船モードで航跡を残す・現在地を表示する・釣り日和や潮流を見る、といった機能は引き続きアプリでお使いいただけます。
ご利用にあたって
- このページは無料で提供しているため、1日に表示できる地図の回数に上限があります。上限に達した日は静止画のプレビューに切り替わります(翌日には戻ります)。
- 地図の表示には Google マップを使用しています。ページを開くと Google に情報が送信されます。詳しくは外部送信についてをご覧ください。
- 出典:海洋状況表示システム(海上保安庁・https://www.msil.go.jp/)を加工して作成。このサービスは、海しるAPIを利用して取得した情報をもとに作成しているが、サービスの内容は海上保安庁によって保証されたものではない。出典:GEBCO Bathymetric Compilation Group 2026 (2026) GEBCO_2026 Grid (doi:10.5285/4f68d5c7-45eb-f999-e063-7086abc036fa) を加工して作成。
We have added "Sea Map & Seafloor Map (Web)" to the official website. It shows the same layers as the app's Marine map and Seafloor map, overlaid on Google Maps in your browser. No sign-in is needed and it is free regardless of tier. Use it on a big screen to look over the water before a trip.
What you can see
- Marine map (MSIL, Japan Coast Guard) — three groups: regulated areas (harbour regulation areas, fairways and anchorages, traffic-safety routes, designated and quarantine anchorages, exercise areas, disposal areas, port and fishing-port areas), aids to navigation and hazards (lighthouses, light buoys, beacons, wrecks, seabed obstructions), and depth contours and seabed (20–200 m contours and bottom type). Shown at zoom 7–16. The symbols are explained in the user guide.
- Seafloor map (GEBCO) — seafloor relief for the world's oceans, colour-coded by depth with shaded relief. Land stays transparent, so Google Maps place names and coastlines remain readable.
- Click for depth — click the map (long-press on a phone) to see the approximate depth (reference only) at that point.
This is reference information for fishing, not for navigation. Boundaries and depths may be inaccurate or out of date. Base navigational decisions on Japan Coast Guard charts and the latest notices to mariners and navigational warnings. The seafloor map is estimated from a grid of about 450 m cells; close to shore, the marine map's depth contours are more accurate (waters around Japan).
How it differs from the app
The web version is an entry point for looking. Overlaying your catches, keeping tracks in Boat Mode, showing your location, and seeing tide and current forecasts remain app features.
Please note
- Because the page is free, the number of map loads per day is limited. On a day the limit is reached, the page shows a static preview instead (it comes back the next day).
- The map is displayed with Google Maps, and opening the page transmits information to Google. See External Transmission for details.
- Source: Marine Situational Indication Linkages (MSIL), Japan Coast Guard (https://www.msil.go.jp/), processed. This service is built on information obtained via the MSIL API; its content is not guaranteed by the Japan Coast Guard. Source: GEBCO Bathymetric Compilation Group 2026 (2026) GEBCO_2026 Grid (doi:10.5285/4f68d5c7-45eb-f999-e063-7086abc036fa).